

Here's my full answer for the pie charts task below.
The charts below show the results of a questionnaire that asked visitors to the Parkway Hotel how they rated the hotel's customer service. The same questionnaire was given to 100 guests in the years 2005 and 2010.
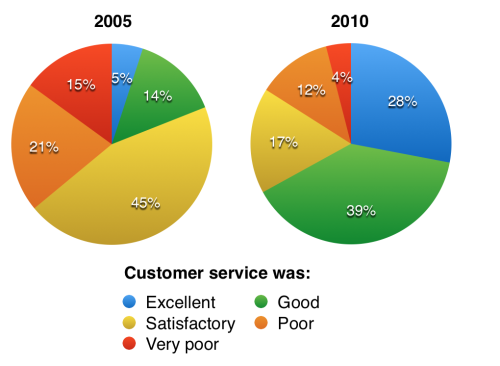
The pie charts compare visitors’ responses to a survey about customer service at the Parkway Hotel in 2005 and in 2010.
It is clear that overall customer satisfaction increased considerably from 2005 to 2010. While most hotel guests rated customer service as satisfactory or poor in 2005, a clear majority described the hotel’s service as good or excellent in 2010.
Looking at the positive responses first, in 2005 only 5% of the hotel’s visitors rated its customer service as excellent, but this figure rose to 28% in 2010. Furthermore, while only 14% of guests described customer service in the hotel as good in 2005, almost three times as many people gave this rating five years later.
With regard to negative feedback, the proportion of guests who considered the hotel’s customer service to be poor fell from 21% in 2005 to only 12% in 2010. Similarly, the proportion of people who thought customer service was very poor dropped from 15% to only 4% over the 5-year period. Finally, a fall in the number of ‘satisfactory’ ratings in 2010 reflects the fact that more people gave positive responses to the survey in that year.
(193 words, band 9)


0 Comments